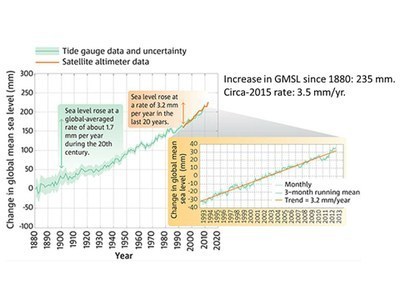
To answer her question, I first looked at what’s happened over the last 135 years. The following chart shows the amount by which the global mean sea level (GMSL) has changed since 1880. Results were initially obtained from tidal gauges around the world (in blue) and more recently from satellite measurements (in red).
 Global Mean Sea Level change since 1880
Although sea levels have been rising, they’ve increased by only 235 millimeters (mm) in 135 years. That’s little more than 9 inches. At such a slow rate, it would seem that, at least in our lifetimes, my wife and I have no reason for concern. But, what might the future hold? Could the rate itself increase over time? The data show that it’s already happening. While sea level increased at an average rate of 1.70 mm per year during the 20th century, it increased at an average rate of 3.2 mm/yr from 1993 to 2012 and by 3.5 mm/yr in 2015.
What if the rate continues to increase over time? Consider one scenario. If it increased on average by 2.3% per year, it would double every thirty years, and by 2100 it would be 24 mm/year. The cumulative effect over 85 years would be to increase the GMSL by an additional 900 mm (about 3 feet). That’s not nearly enough to put our home at the sea’s edge, but it’s more than enough to wreak havoc in many regions of the world.
Billions of people live in coastal areas, with hundreds of millions in low-lying regions no more than 3 feet above sea level. Areas that would be especially vulnerable are the U.S. Gulf states; rice producing regions of South and Southeast Asia; and mega-cities like Shanghai, Mumbai, Tokyo and New York. Exacerbated by extreme weather events, damage to infrastructure (buildings, roads, railways, airports, and pipelines) would be extensive. In submerged coastal regions, salinization of fresh water supplies would decrease agricultural production and access to drinking water.
The foregoing effects are already being felt in Bangladesh, a nation of more than 160 million people, with many already forced from their homes by rising seas. The U.S. Department of Defense describes rising seas as a “threat multiplier,” one that amplifies impairment of essential resources like infrastructure, food and water, thereby increasing prospects for political instability, mass migrations and conflict.
But, is such a scenario plausible? Could GSML actually rise another 3 or more feet by the end of the century? If so, what could cause it to happen?
There are two things that have historically contributed to rising seas. First, as ocean waters warm, GMSL increases as the volume of water increases due to thermal expansion. Second, as the lower atmosphere warms and land-based ice melts, GMSL increases as the water finds its way to the oceans. Although both agents have been in play during the 20th century, it’s unlikely that thermal expansion will be any more influential in the 21st century. But loss of land-based ice could be another matter.
Much of the earth’s remaining fresh water is concentrated in two enormous ice sheets, one on Greenland and the other on Antarctica. Both extend as much as 10,000 feet above the bedrock on which they rest, with the Greenland Ice Sheet (GIS) holding a sea rise equivalent of 23 feet and the Antarctic Ice Sheet (AIS) 190 feet. Although it would take centuries, if not millennia, for complete loss of the ice sheets, losses could be large enough to increase the rate of sea level rise and correspondingly GMSL by more than 3 feet before the end of this century. Here’s how it could happen.
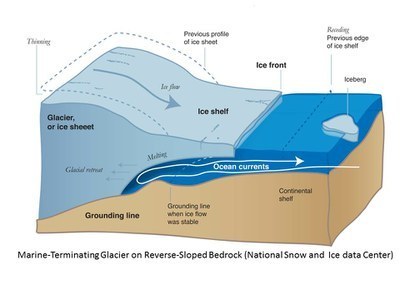
Both ice sheets are ringed by massive glaciers which experience gravity-driven flow to the surrounding seas. As shown in the schematic, these marine-terminating(outlet) glaciers are buttressed by floating ice shelves. The grounding line defines the boundary between a glacier supported by bedrock and its ice shelf. The width and length of a floating ice shelf can range from tens to hundreds of miles and its thickness from hundreds to thousands of feet, 90% of which is below sea level.
As an outlet glacier and its ice shelf move seaward, it’s natural for the shelf to periodically experience calving events that release ice bergs into the open sea. Since the ice shelf from which it came is floating, the ice berg contributes little to rising seas. However, portions of the glacier that continuously move past the grounding line represent a loss of land-based ice, and unless balanced by accumulated snowfall on the glacier, they can contribute significantly to rising seas.
An ice shelf buttresses its glacier by resisting its motion to the sea. But, if the shelf begins to disintegrate due to excessive calving and thinning due to melting at the top and/or bottom surfaces, its ability to impede movement of the glacier is diminished. Accelerated motion increases discharge of land-based ice to the sea, thereby increasing the contribution of the glacier to rising seas. These conditions (disintegrating ice shelf and a retreating glacier) are shown in the schematic.
The schematic also shows how conditions are worsened if the bedrock has a retrograde (downward) slope. As the ice shelf and its grounding line retreat, the sea bed deepens and more ice is exposed to warm ocean waters below sea level, with melting increasing the contribution to rising seas. Moreover, as the height of the glacier above sea level increases with movement of the grounding line, ice cliffs more than 1,000 feet high can become unstable, collapsing into the sea and causing calving to occur at or close to the grounding line. Many large glaciers on the GIS and AIS are supported by reverse-sloped bedrock with deep troughs lying thousands of feet below sea level. Combine warming ocean waters with a receding ice shelf and movement of the grounding line into a downward sloping bedrock and you have a perfect storm of conditions for accelerating glacial flow to the sea and increasing the rate of rising sea levels.
Before you read further, take a moment to look at Part 1 of a three-part New York Times series on Antarctica. It provides an insightful animation of glacial flows and their potential contribution to rising seas.
The fact is that ice shelves have started to recede on both the GIS and AIS. Today, the Greenland Ice Sheet is the world’s largest contributor to rising sea levels. The Jakobshavn glacier, which is Greenland’s largest, has been receding at an accelerating rate, and over the last 20 years its grounding line has descended on a retrograde bed from a depth of 2,300 to 3,600 feet. In 2015 the glacier experienced the largest calving event recorded on film and will continue to retreat along a retrograde slope for decades to come. And, augmented by increased surface melting, Jakobshavn and other outlet glaciers will increase the rate at which the GIS contributes to rising seas. Jakobshavn alone has the potential to increase GMSL by 2 feet.
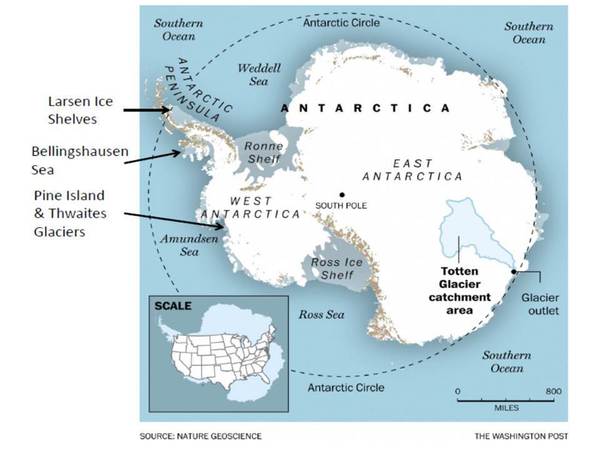
But the biggest threat to rising seas comes from the Antarctic Ice Sheet. It covers more than 5 million square miles and rises more than 10,000 feet above sea level. It also has many large glaciers on retrograde bedrock that drops as much as 5,000 feet below sea level. The ice sheet has three sections: the Antarctic Peninsula, West Antarctica and East Antarctica.
At one time the Antarctic Peninsula had three ice shelves termed Larsen A, B and C. But, due to melting at the top and bottom surfaces from increasing air and water temperatures, the shelves began to recede. Larsen A completely disintegrated in 1995, and Larsen B collapsed in 2002. And, on July 12, 2017 Larsen C discharged an iceberg covering an area of 2,200 square miles and weighing more than one trillion tons, one of the largest on record. Ice shelves abutting the Bellingshausen Sea on the southern end of the Peninsula have also been accelerating, mirroring behavior of the Larsen shelves. Although, collectively, the ice shelves do not buttress enough land ice to significantly affect sea level, the same cannot be said of outlet glaciers on the West Antarctic Ice Sheet (WAIS).
The Pine Island glacier has a 25 mile wide ice shelf and a sea-rise equivalent of 1.7 feet. It is already showing signs of imminent collapse, and in 2015 a 225 square mile iceberg was calved from its shelf. What was unusual about the event was not the size of the iceberg but that the crack originated near the center of the shelf, instead of at its margins, and at the bottom instead of the top, a clear indication of the effect of warming ocean waters on melting from below. On September 23, it experienced its fifth large calving event since 2000, again attributed to heating from below, and the grounding line continues to move inland on a downward sloping sea bed. The neighboring Thwaites glacier is of even greater concern. It’s larger than the state of Pennsylvania and has a 75 mile ocean front that makes it highly vulnerable to melting from below.
With decreasing resistance from their ice shelves, the Pine Island and Thwaites glaciers are accelerating in their motion to the sea. The grounding line for the Thwaites glacier is already 2,300 feet below sea level, and if it continues to retreat, it could exceed 7,000 feet, exposing ever more ice to warm water. Loss of the Thwaites glacier alone would increase GMSL by 2 feet, while collapse of all five glaciers abutting the Amundsen Sea would increase GMSL by 4 feet.
There are also growing concerns over eventual collapse of the Ross and Ronne ice shelfs, which currently stabilize much of the WAIS. Were all of the WAIS to collapse, it would raise GMSL by almost 10 feet. Thought to be immune to mass loss, the EAIS also appears to be vulnerable to warming sea waters. Its largest glacier (Totten) is experiencing intrusion of warm water with melting and thinning of its ice shelf from below. The grounding line is retreating, and although it is by no means imminent, collapse of Totten alone could raise GMSL by more than 11 feet.
So, will the rate at which sea levels are rising continue to increase? Yes! And it will be driven largely by destabilization of glaciers on the world’s two large ice repositories. Could it double every thirty years, and could sea levels rise more than three feet by the end of the century? Yes! And the effects would be felt throughout the world. Diminished water and food security, along with social and political instability, would affect the lives of billions of people, and not just those living in coastal regions. Eventual loss of the GIS and WAIS, much less deterioration of the EIAS, would reshape the world as we know it today.
Back to my wife. Should she be concerned about the impact of rising seas on our home? In our lifetimes, the answer is “no.” Of far greater concern would be the growing frequency and intensity of extreme weather events. Had Super Storm Sandy struck the New Hampshire seacoast instead of the New York and New Jersey shores, the storm surge could have inflicted heavy damage to our humble abode.

