I’m going to begin and end with some comments on why words matter. The first comments deal with science and the last with politics.
Last year I went back-and-forth from being amused to annoyed by how the terms “global warming” and “climate change” were being used and how they had become yet another lightening rod for partisan politics. How could politicians and pundits be so confused and, wittingly or unwittingly, create such a distraction from the real issues?
Both terms are relevant, but they have separate meanings. Simply put, global warming refers to increasing temperatures in the Earth’s lower atmosphere and oceans, while climate change refers to long-term - decades to centuries - changes in the Earth’s climate system. Global warming is the cause; climate change is the effect.
Warming (and cooling) have occurred naturally over time frames measured in tens of thousands of years, cycling the Earth between ice ages and warmer, interglacial periods, like the one we are currently enjoying. But, for roughly the last 150 years, something different has been happening.
Annual Average Global Atmospheric Temperatures
The following graph shows how the temperature of the Earth’s lower atmosphere has varied from 1880 through 2017. The data were compiled by the National Aeronautics and Space Administration, and essentially equivalent results have been obtained by other agencies.
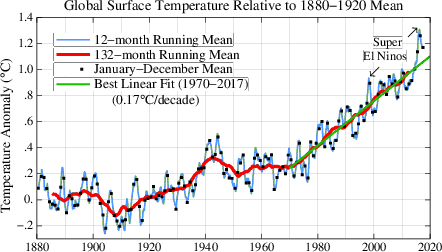
Rapid Rise in Temperature
The average temperature for 2017 was about 1.2 degrees Celsius (2.2 degrees Fahrenheit) above the mean 1880-1920 (baseline) temperature. This may not seem like much, but consider that it only takes a shift of 4 to 5 degrees Celsius to take the Earth into and out of an ice age. But what’s caused this rapid rise over such a relatively short time frame, and how do we explain the year-to-year fluctuations in the annual (January to December) mean?
The Earth’s atmosphere, land and oceans represent a system, and like any system (e.g., your home), if more energy enters than leaves, the temperature rises. For the Earth, there’s only one in-flow − solar radiation − and one outflow − terrestrial radiation emitted by the Earth that makes its way to outer space. Although there’s been little change in the inflow over the timeline of the figure, there’s been a gradual reduction in the outflow. Why is that?
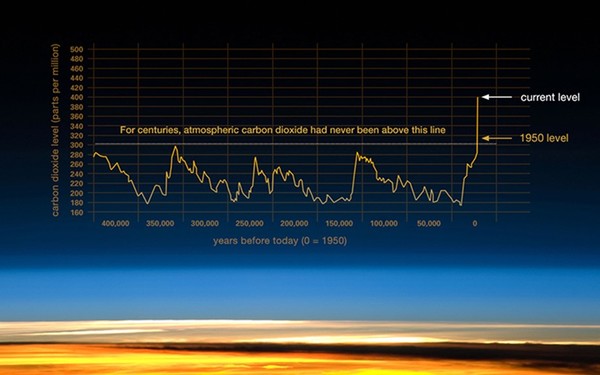
Carbon dioxide (CO2) in the Earth’s atmosphere absorbs a much larger fraction of terrestrial radiation than solar radiation. That’s why it’s called a greenhouse gas (GHG). In fact, without CO2, our planet would be a colder, much less hospitable place to live. But, since the start of the Industrial Revolution in the 18th century, the amount of CO2(measured in parts per million, ppm) has increased from about 280 ppm to 406 ppm in 2017. And, it continues to increase at more than 2 ppm per year, trapping ever more terrestrial radiation and increasing the imbalance between the Earth’s energy inflow and outflow.
The following graph shows a 400,000 year time line of the atmosphere’s CO2 concentration. The rapid rise over little more than a century is due to one thing and one thing only – human activities that discharge CO2 into the atmosphere, primarily by burning fossil fuels but also through other activities such as deforestation. And, although CO2 makes the largest contribution to warming, it’s not alone. Concentrations of other greenhouse gases, such as methane and dozens of synthetic chemicals, are also increasing.
 Temperature fluctuations
Temperature Fluctuations
Looking again at the first figure, why does the annual average temperature (the January-December mean) bounce up and down? It’s because there is still natural variability, none more influential than what’s called the El Niño Southern Oscillation (ENSO). In El Niño years, upwelling of warm water in a large portion of the tropical Pacific transfers energy to the atmosphere, increasing the global mean temperature. During La Niña years, the inverse is true. As surface layers of the Pacific cool, energy is transferred from the atmosphere, decreasing the global temperature. This back-and-forth effect is revealed by the up-and-down swings in the black dots of the figure. But the effect does not mean that changes in the atmospheric temperature are due exclusively to natural variability. The changes are due to the combined effects of human activities and natural variability, and it’s human activities that are causing the overall upward trend.
The first figure highlights two “super” El Niño years, one in 1998 and the other in 2015-16. The 1998 event was followed by a large temperature drop in 1999 (a La Niña year) and little deviation from the 1998 maximum over the next 15 years. That prompted many skeptics to dismiss the human influence. But in 2014 a new temperature record was set, only to be crushed in 2015 and again in 2016 by another super El Niño. The temperature dropped in 2017, but not as much as expected for a La Niña year, and the last four years have been the hottest on record.
We'll continue to see ups and downs in the annual average atmospheric temperature due to natural variability, and we may see another extended period of little overall change. But, make no mistake, from decade to decade, the atmosphere will continue to warm, and by 2050 its temperature will likely exceed the baseline by 1.5 degrees Celsius.
Ocean Warming
If you’re still not convinced that the Earth is warming, take a look at what’s happening in its oceans. Since 1958 the energy content of the upper 2,000 meters (one and one-quarter miles) of the world’s oceans has been measured, and annual averages are shown in the next figure. Don’t concern yourself with the amount of energy. Suffice it to say that it’s really large. Just look at the trends. As we saw for the annual average temperature in the first figure, the trend is one of increasing energy content.
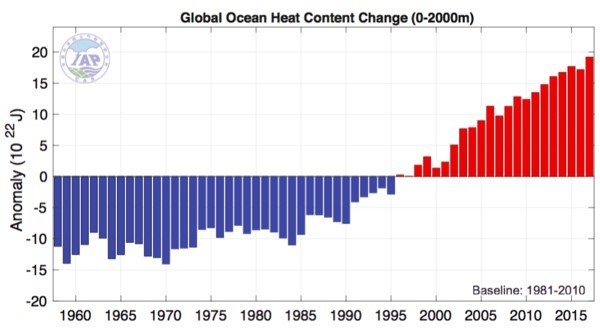
The science is solid. Like it or not, global warming is occurring, and it will occur at an increasing rate if we continue to increase the atmospheric concentration of GHGs. Now, what about climate change?Again, there’s some natural variability in the results, but because about 90% of the imbalance between energy flowing into and out of the earth-atmosphere system is absorbed by the oceans, it is much smaller than the variability in the atmospheric temperature. While the atmospheric measurements experienced little overall change from 1998 to 2013, the ocean measurements continued to increase, as the amount of solar radiation entering the system exceeded − from moment to moment, day-to-day, and year-to-year − the amount of terrestrial radiation leaving.
Climate Change
Yes, the climate is changing. We see it in the increased frequency and strength of extreme weather events. Extremes in rainfall and flooding, as well prolonged drought and water shortages, are becoming the norm in many regions of the world, affecting food production and the natural environment, as well as critical infrastructure. Last year alone the U.S. experienced three of the five most costly hurricanes in its history: Harvey ($125B), Maria ($90B) and Irma ($50B). And, driven by increasing atmospheric and water temperatures, as well as rising sea levels, it will only get worse. A temperature rise of 1.5 degrees Celsius by 2050 will inflict significant human hardship and economic loss, and a rise of 2 degrees by 2100 will reshape our world. To the extent that current costs are ignored or covered by deficit spending, they and future costs will be borne by future generations.
A Political Dimension
Now the politics. POTUS has tweeted that those concerned about global warming and climate change are “hoaxsters,” “con artists,” and “dollar sucking wise guys.” I’m not offended by the comments, but I am concerned. Supporters of the President number in the tens of millions, and they are ready to believe whatever he tweets and says. By demeaning the seriousness of the problem and those who seek solutions, his comments make it easier to ignore the facts and to amplify social and political divisiveness.
But, what if POTUS took some time to understand the issues? If he chose to bypass the decades long work of NASA and NOAA, whose scientists have amassed and analyzed a trove of data on the subject, he could still seek input from the National Research Council, an organization formed in 1916 to advise the federal government on policy matters that involve science and technology. The Council draws on input from leaders across the entire spectrum of science and technology and has served the nation with distinction for more than a century. What if he took the time to weave their input into a comprehensive national energy policy that “threaded the needle” by striking appropriate balances between economic and environmental considerations? I can think of no other person in the world who, at this juncture, would have a greater impact on addressing a problem that will increasingly affect every human being, none more so than those yet to be born.
Wishful thinking? Probably! But, what if?